Table of Contents
| Table of Contents | ||
|---|---|---|
|
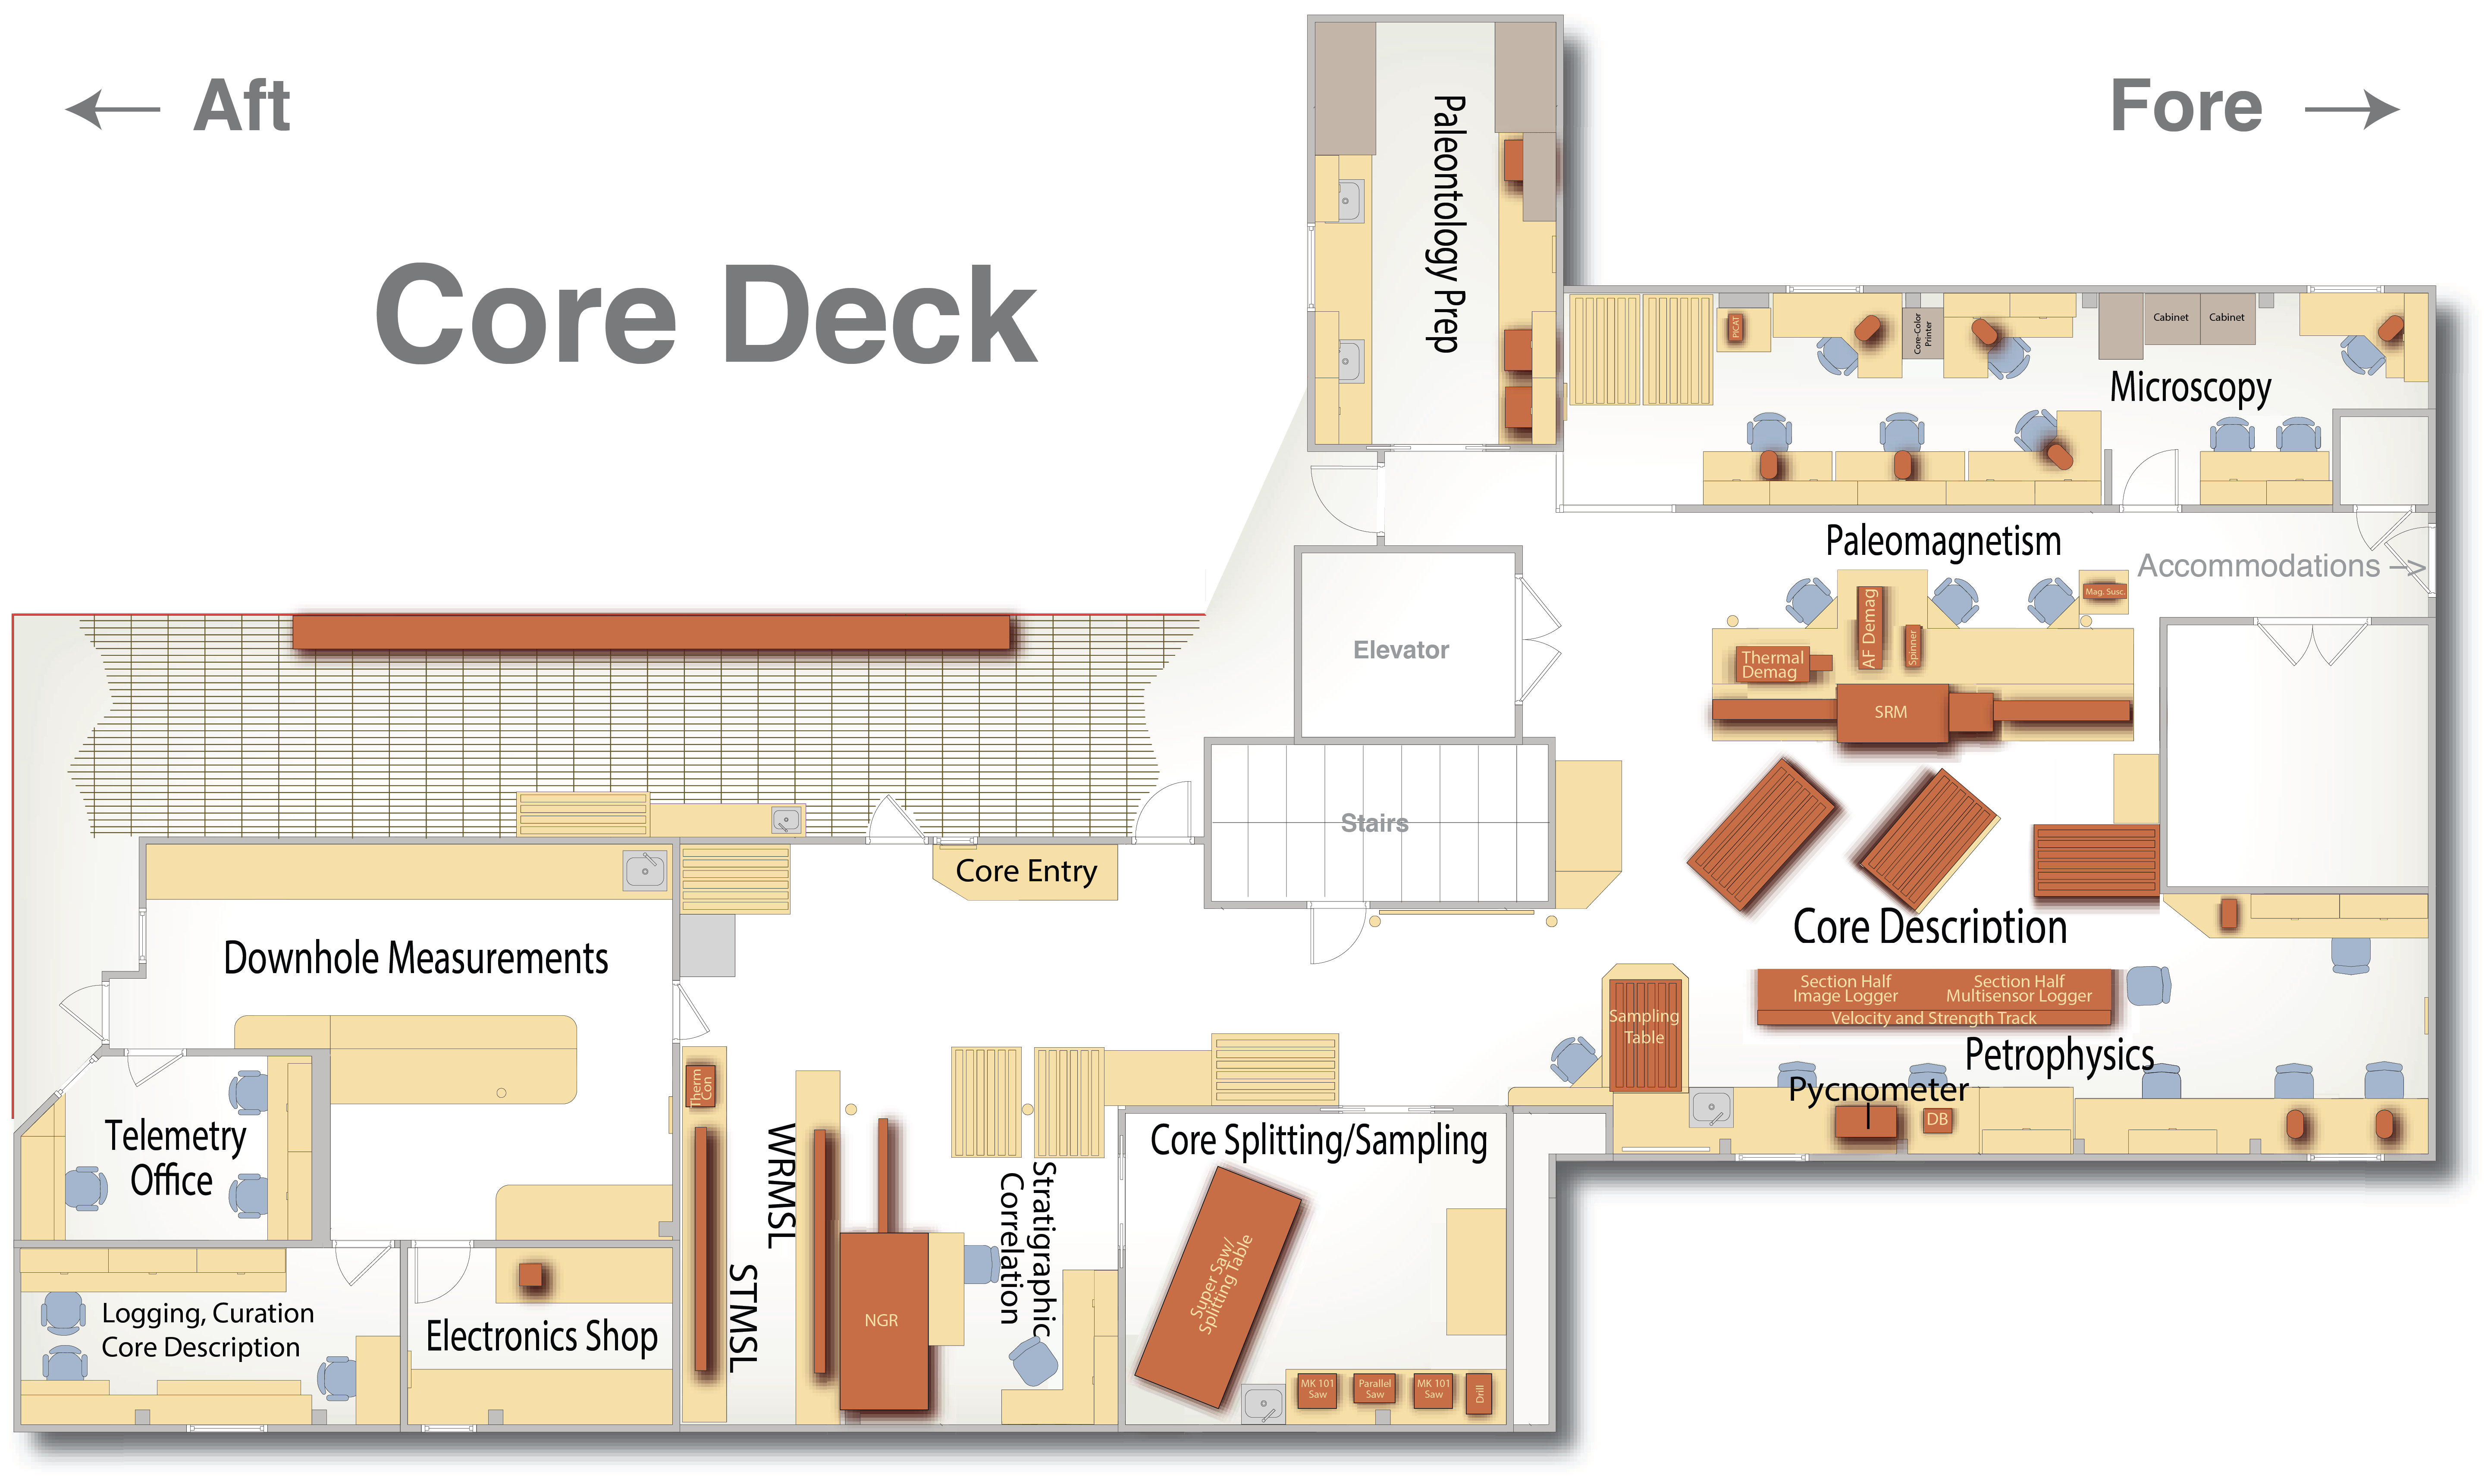
Core Deck map where the Physical Properties instruments are located.
Overview
The Physical Properties Lab measures magnetic susceptibility, density, P-wave velocity, natural gamma radiation (NGR), moisture content, thermal conductivity, and visible spectral reflectance of rocks and sediments and captures a digital image of the split-core sections. Physical properties are indicators of composition, formation, tectonic regime, and environmental conditions of the deposits. Some properties can be measured rapidly at high spatial resolution and serve as proxies for processes such as paleoclimatic change.
Moisture and Density (MAD)
Multisensor Loggers (WRMSL and STMSL)
The Whole-Round Multisensor Logger (WRMSL) and Special-Task Multisensor Logger (STMSL) are similar track systems for measuring the magnetic susceptibility, density, and P-wave velocity of whole-round core sections. WRMSL and STMSL used identical software and hardware from Expedition 371 up to Expedition 379. During Expedition 379 (January 2019), the P-wave velocity logger (PWL) was removed from WRMSL and replaced with an interchangeable X-ray system. The terms WRMSL and STMSL are somewhat interchangeable, and so after the installation of the XMAN X-ray imager on the forward track, the aft track is now the primary core logging track (with GRA, MS, and PWAVE_L) and the forward track can be used in either GRA+MS mode or XMAN mode. When the need arises for "fast track" stratigraphic correlation, the forward track is used in GRA+MS mode and the XMAN system is not used.
The GRA and PWAVE_L data are calibrated against standard reference materials. The MS data are checked against a water-filled core liner, and because the geometry is not fully known inside the core liner, the results are only recorded and reported as instrument units.
Natural Gamma Radiation Logger (NGRL)
NGR data are acquired using eight custom-built scintillation detectors arranged along the core measurement axis at 20-cm intervals. The NGR system uses layers of active (plastic scintillators) and passive (lead) shields to obtain maximum signal-to-noise ratio. A measurement run typically consists of two sample positions, 10 cm apart, for a total of 16 measurements per 150 cm section. Counting times are set by the user and are typically 5 min per position, or ~10 min per core section. During high-recovery expeditions, the user has the option of only running one position (interspersed 10 cm data with 10 cm of no-data), or the run time may have to be decreased, which may affect data quality for low-radioactivity core sections.
P-Wave Velocity Bayonet/Caliper Gantry (PWB/PWC)
PWV data were acquired by transmitting a p-wave pulse either through the sediment section half (PWB or PWC) or across the faces of a cylinder or cube-shaped sub-sample in the X, Y, or Z-direction(PWC). Travel time is determined by first arrival of the p-wave signal at a precision of approximately 50 ns. Results are corrected for system propagation delay, and liner thickness and material velocity if applicable. The PWB is a pair of bayonets that can measure p-wave velocity across the X- or Z-axis of section halves; they do not work on consolidated sediment, basalt, or discrete samples. The PWC is a caliper that can "grip" discrete samples or measure the Y-axis signal of a section half.
Section Half Imaging Logger (SHIL)
The SHIL uses a 50-micron resolution linescan camera to acquire full-color images of section halves or the outer surface of hard rock whole-round sections. The SHIL produces a TIF image (~160 MB/150 cm section) and a pair of JPG images: one is uncropped and shows the ruler, the other is cropped to only the section material. In addition, JRSO produces an RGB data set derived from the JPG image, typically the average of the center 2 cm (X-axis) of the section, at a resolution of 0.5 cm (Z-axis).
Section Half Multisensor Logger (SHMSL)
The SHMSL is equipped with three sensors: color reflectance, magnetic susceptibility (point), and a laser rangefinder. Color reflectance (RSC) data were acquired using an Ocean Insight QE-Pro spectrophotometer which records 2 nm-resolution data in the visible range. Spectral data are transformed to X,Y,Z tristumulus values, which can be related to color in the CIE cylindrical coordinate system (L*a*b* ) where L* is luminosity (total light reflected), a* is redness (blue + green), and b* is yellowness (red + green). MS data were acquired using one of three point sensors: JRSO currently uses the MS2K sensor, which has a 1 cm recording area and a small pickup area; in the past MS2E or MS2F sensors have been used. Because the sensor is in contact with a section half, the MS data on the SHMSL is calibrated to SI magnetic susceptibility units (unlike the MS2C loops on the WRMSL/STMSL, which must be reported in instrument units because the sample volumes are unknown). The laser rangefinder records the surface height of the core section. Its primary function is to allow the instrument to find flat places to land the MS and RSC sensors, but it also records the log of the surface height.
Shear Strength Gantry with Automated Vane Shear (AVS)
The gantry has a number of sensors mounted to it. One is a Giesa Automated Vane Shear (AVS) system which can be used to measure vane shear strength on unconsolidated sediments. The gantry also mounts two bayonets (Y- and Z-axis) and a caliper (X-axis on section halves; any axis on discrete samples) to measure p-wave velocity. In addition to the sensors mounted on the gantry, this part of the physical properties laboratory is also equipped with Torvane manual vane shear and Pocket Penetrometer manual shear strength tools.
- Automated Vane Shear (AVS) Quick Start Guide
- Sediment Strength User Guide
- Torvane and Penetrometer Quick Start Guide
TeKa TK-04 Thermal Conductivity Meter (TCON)
- TK04 Quick Start Guide
- TK04 User Guide
- TK04 Manufacturer User Guide: Available to shipboard scientists upon request.
- TK04 Report: Comparison of TeKa TK04 and Hukseflux TPSYS02 systems ← This could be useful to users and needs to be available somewhere.
- A report by Rob Harris (currently in draft form only)
X-ray Linescan Imager (XSCAN)
Debuting on Exp. 399, the XSCAN uses a 48-micron resolution (~ 39 microns on the split-core plane) TDI linescan camera to acquire X-ray images of section halves or whole-round sections. It is capable of up to 180° of rotation around the section's Z-axis for imaging multiple view angles. It is also capable of imaging a portion of a section rather than the entire thing, at multiple angles if desired. The XSCAN produces a TIF image (~175 MB/150 cm section) and a pair of JPG images: one contains a cropped image with a virtual ruler and sample label, the other is cropped only to the section material. It will ultimately replace the area-scan X-man imaging system on the forward whole-round logging track.
| Table of Contents | ||||
|---|---|---|---|---|
|