Table of Contents
System Overview
The JRSO Bathy-2010 system is installed in the Underway Geophysics Lab and consists of a 10kw LPT Transmitter (located at the bottom of the rack), a Sonar Processor, and Windows computer. It is designed to provide the user full ocean depth bathymetry and sub-bottom profiling with a 3.5 kHz transducer array consisting of 12 transducers and a single 12 kHz transducer located in the sonar dome. The sonar dome is attached to the ship’s hull forward of the moon pool, approximately where the gym is.
Assumptions
This quick start guide assumes that the Underway (U/W) Technician has set up the file folders, application, and supporting infrastructure so that the Bathy2010 system is ready to use. If this is not the case, see the Bathy2010 User Guide and the Bathy2010 vendor manuals.
Bathy 2010 Application
Start up the Bathy2010 application by double clicking the icon on the computer desktop or open from the Start menu. During start up, view the Sensor Status window located on the left side of the screen (See Figure 1). Once the Sensor Status indicates a “Sensor:Idle” message, you are now ready to start pinging and operate the system. The main sonar screen looks like this.
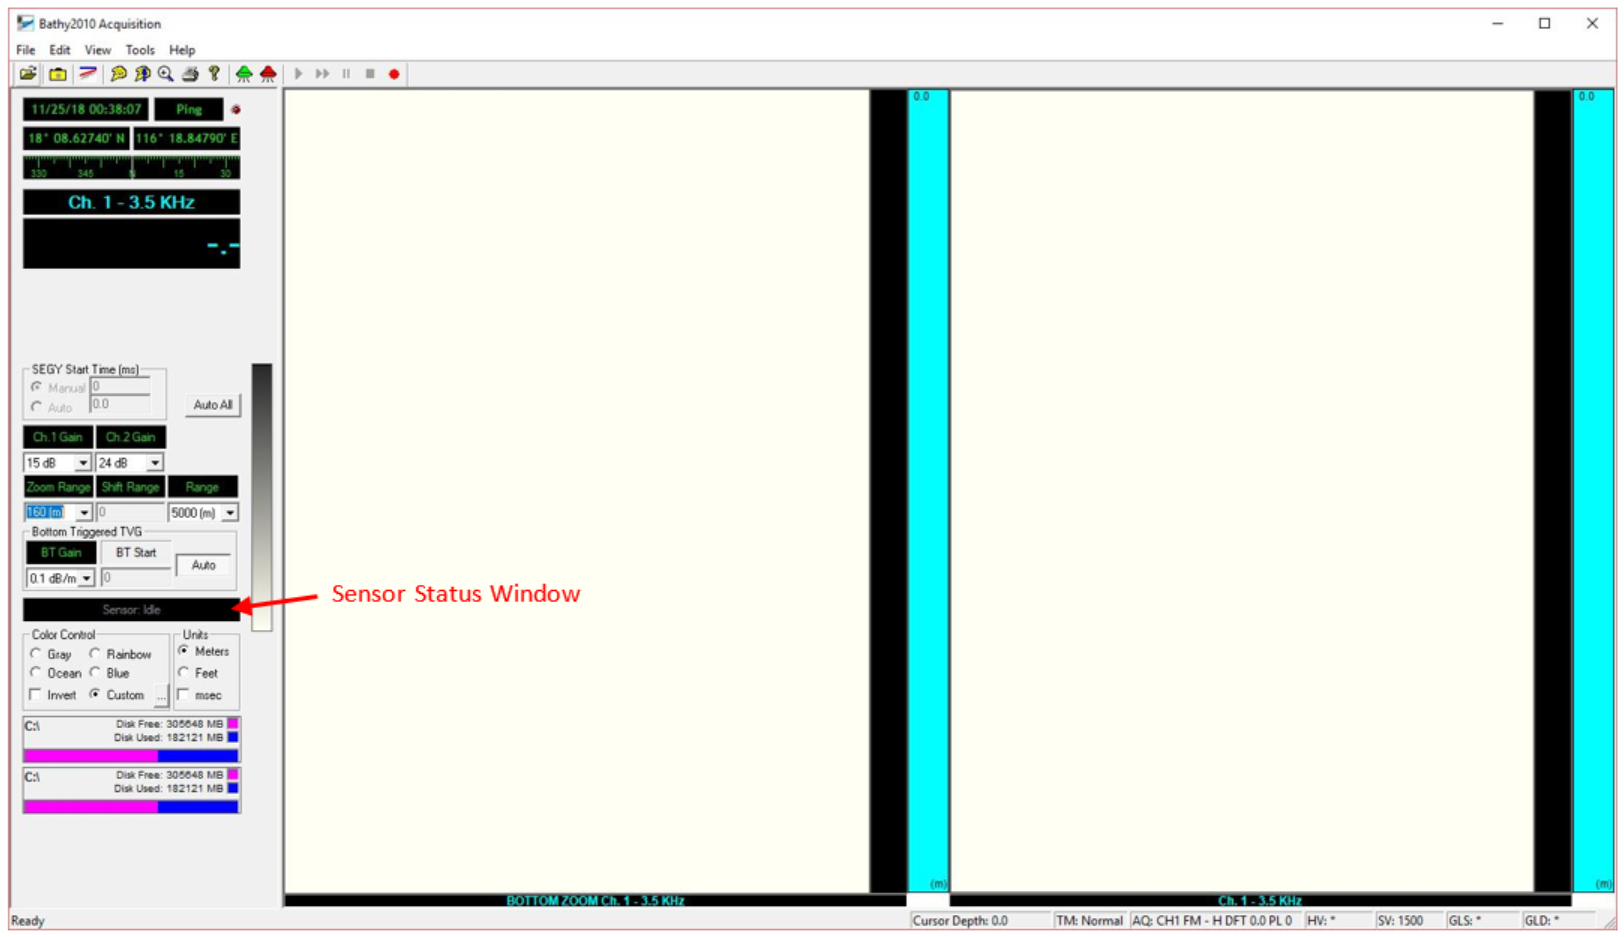
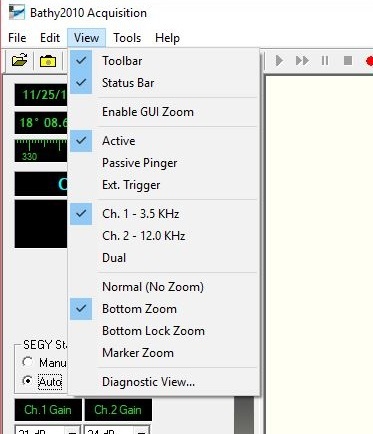
Figure 1 : Main Bathy2010 window Figure 2: View menu
- Verify that GPS data and time is updating in the windows in the upper left corner. If they are not, refer to the Bathy2010 User Guide.
- Under the View menu, select Ch.1 - 3.5 KHz and Bottom Zoom (See Figure 2).
- Open the Edit drop down menu and select “Configure Acquisition Parameters…” to set the power levels for Channel 1 (3.5 kHz) and/or Channel 2 (12 kHz), if in use (See Figure 3).
- From the drop down menu, select a power of -24 dB for Channel 1 to begin with and “Apply”.
- 0 dB is the maximum power output and drops down from there as a “-“ number.
- The transducer power is intentionally set low to begin with so that the transducers don’t start pinging loudly and abruptly. Once the sonar is pinging, the power can be brought up stepwise to get a good return signal. Go down to the upper tween and lower tween accommodations to hear what the sonar sounds like down there.
- From the drop down menu, select a power of -24 dB for Channel 1 to begin with and “Apply”.
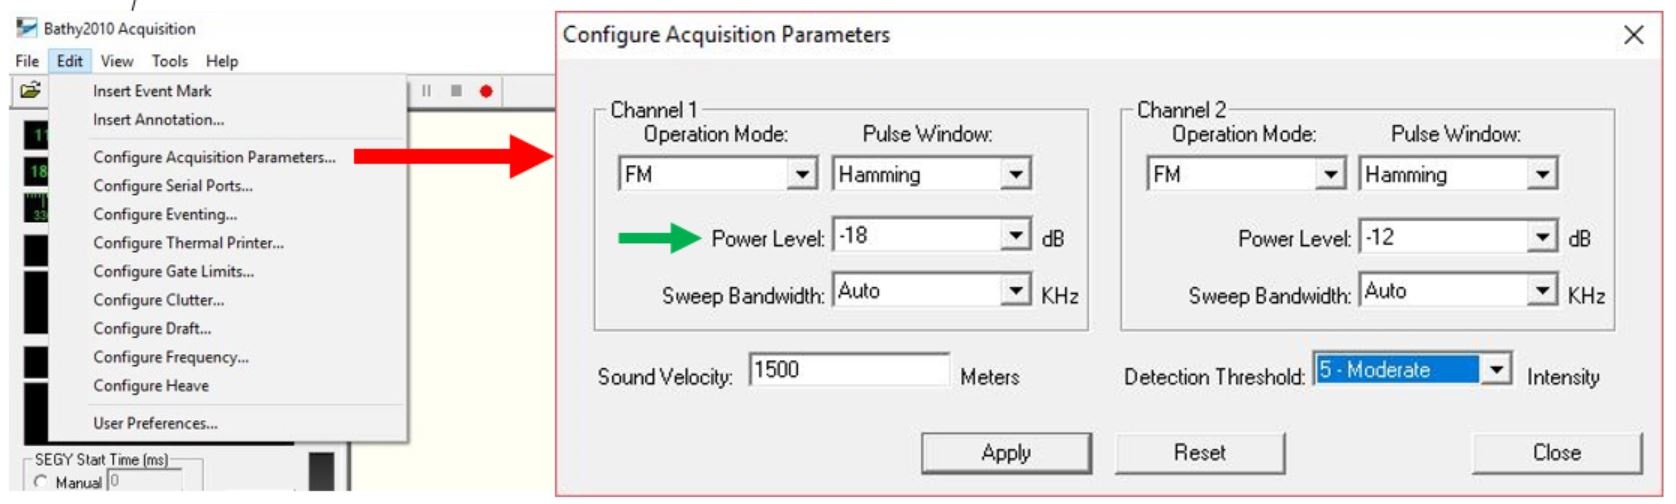 Figure 3 : Acquisition Parameters ( power level)
- On the main sonar screen, select the depth RANGE from the drop down menu for the water depth range you anticipate the ship is in (Figure 4). This will set the ping rate and the range of the full depth window.
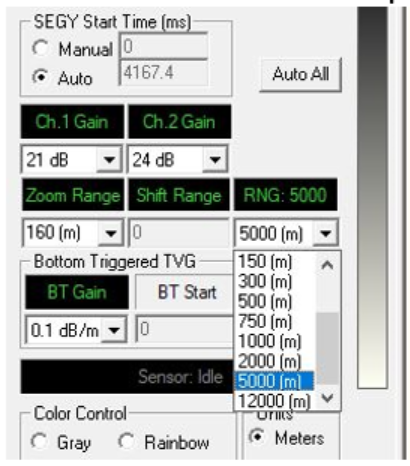 Figure 4 : Depth Range
- Set the SEGY Start Time to “Auto”.
Click the Green transducer icon  to start pinging the sonar. The sensor status window will change to “Sensor:Pinging” and the letters will turn green.The transducers will start pinging and the depth record should start displaying.The screen below (Figure 5) shows only the 3.5 kHz sonar with the full depth scale on the right and the bottom zoom window on the left.
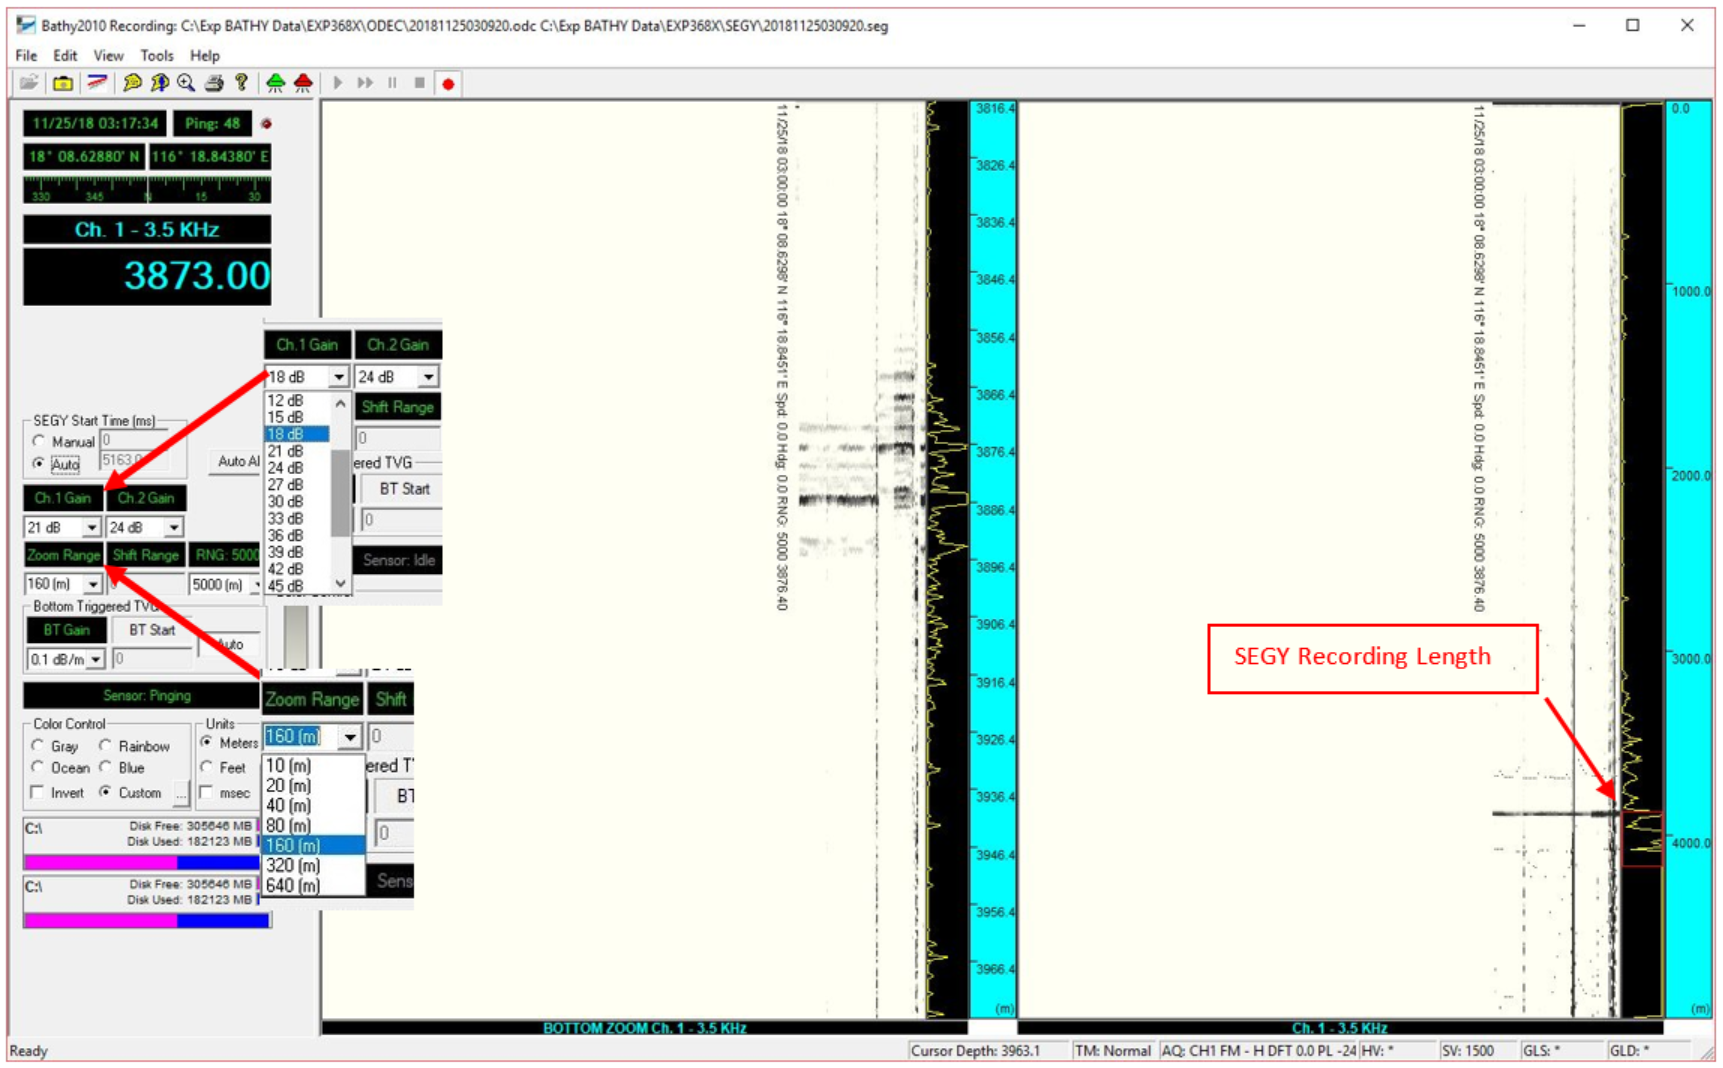 Figure 5 : Main window (pinging record)
- The sonar will have to ping a few times before it will detect and display a bottom depth in meters. In the example above, Figure 5, the seafloor depth detected by the sonar is shown in the “Ch. 1 – 3.5 kHz” window (big blue numbers). The display windows show a nice seafloor on the right and shows some sub-bottom reflectors on the left in the zoom window.If you are not finding the seafloor there are a few things you can do.
- Change the depth range as shown above in Figure 4. It could be that the sonar is set to the wrong depth range.
- Increase the power of the sonar in the “Configure Acquisition Parameters…” window (Figure 3).
- Increase or decrease the Channel Gain from the drop down menu as shown above (Figure 1).The gain amplifies the signal received by the transducer. Increasing the gain can amplify the signal to see better reflectors but it also amplifies noise. Try different settings to see the response and try to find a setting that works. During heavy seas, or when the thrusters are down, a lot of noise can be generated and changing the gain may or may not help. Note in the example above that the gain was increased during the survey and can be seen to help see the seafloor and the sub-bottom reflectors.
- The left bottom zoom window on the main sonar screen in Figure 5 shows a zoomed in portion of the sonar record and is windowed around the established seafloor depth determined by the application and will adjust automatically. The user can adjust the zoom range in meters from the drop down menu shown above.If the application has not established a seafloor depth or loses the depth the bottom zoom window will reset to start at 0m.
Data Logging
The software records three data files; CSV, ODC, and SEGY ,in two folders on the (C:) drive.
Start the data logging after the sonar is pinging.
- From the File drop down menu select “Start Recording” and the Recording Data Confirmation window opens (Figure 6).
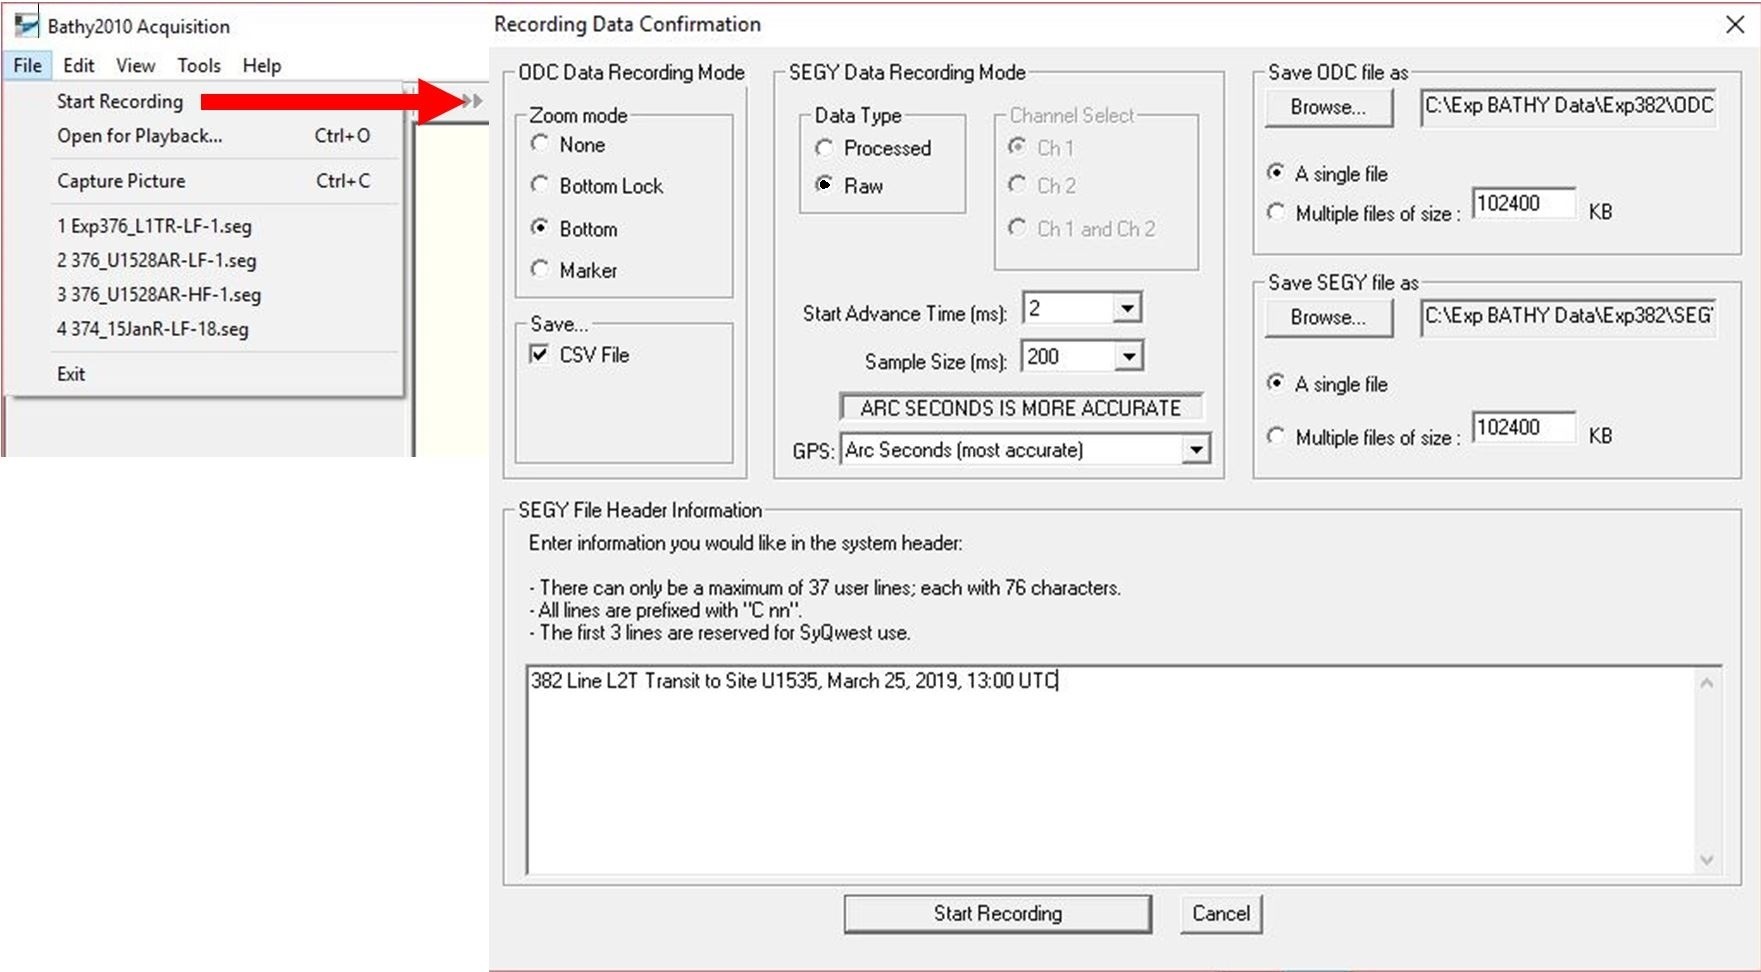
Figure 6 : Recording Data Confirmation
- Select the recording parameters as shown in Figure 6 with Data Type RAW.
- Browse to the correct expedition file folders for the ODC and SEGY files. These folders should be set up on the (C:) drive as seen in Figure 7.
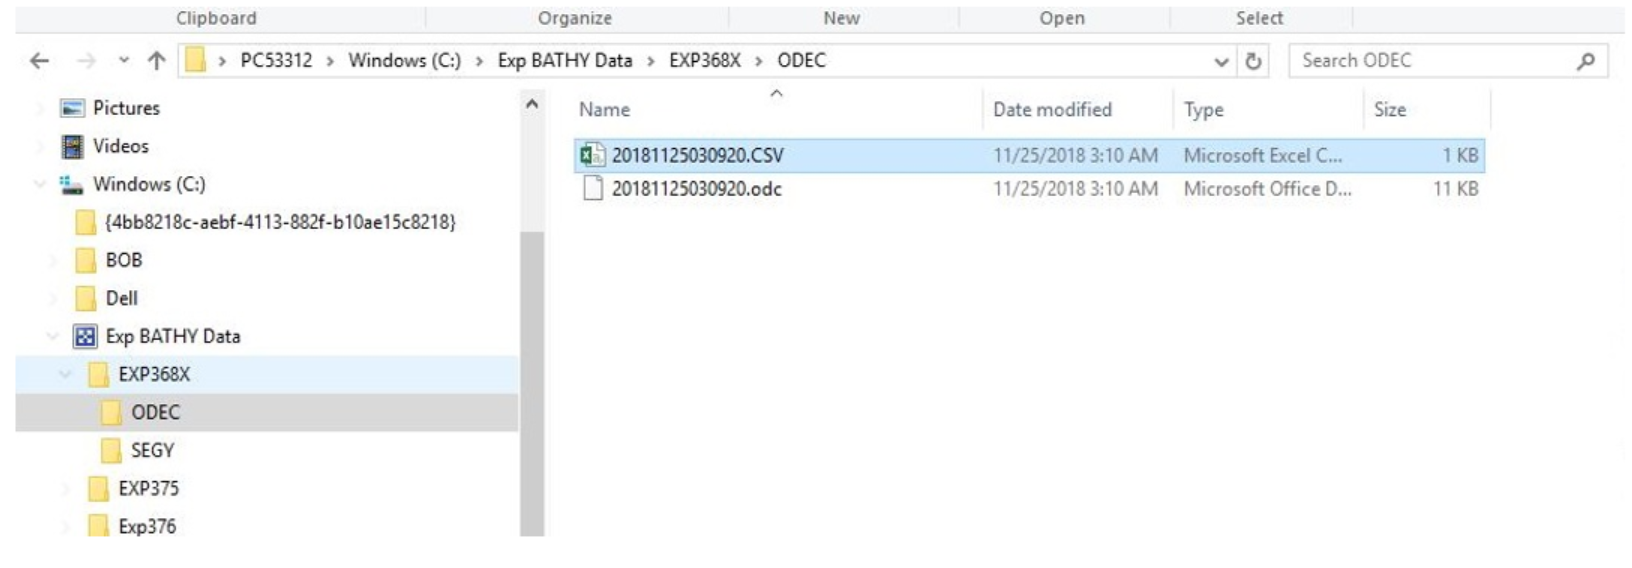 Figure 7 : File Folder Structure
- Enter a description of the activity, time, and date in SEGY File Header Information field.
- Click “Start Recording”
- Note that the file path and file names will appear in the very top header of the application window (Figure 5).
- The red box graphic on the full depth display on the right (Figure 4) represents the length of time the SEGY file will record. If the SEGY Start Time is set to “Auto” then the graphic will adjust automatically with the seafloor depth when the application is displaying a seafloor depth.
While Underway (Underway Watch)
- The JRSO does not formally staff underway watches like in the past, however, staff need to monitor the equipment and data streams.
- Open the remote desktop connections for Winfrog 1 and 2 computers on the big screen in the LO Office. From here, the WinFrog application, Bathy2010 and SeaSpy (magnetometer) can be monitored regularly by the technical staff.
- Adjustments can be made to the Bathy2010 settings while underway to improve the data quality or find the seafloor if it is lost. In rough seas it can be very difficult to track the bottom and accumulate data. If conditions are too rough to collect decent data then the system can be turned off until conditions improve, discuss with the LO.
Archive Versions
SyQwestBathy2010QuickStartGuide.pdf - Feb. 24, 2020